Tip: Get this intro to PostHog as a private repo you can share with your team. Learn the basics while documenting the specifics of your integration.
With integration complete and activation defined, we turn our sights toward measuring how well we keep our customers coming back.
This is retention. Much like activation, retention can vary from product to product.
Once more, we need to think about retention as a precursor to revenue. What kind of ongoing usage can we use to measure that people are happy with what they get from us, and will be just as happy to pay for it?
Activation is a good sign, but if someone doesn't use our product on an ongoing basis, that could be a problem.
The lower our product's retention, the more we have to keep acquiring new customers just to stay in the same place.
Thinking about retention
A simple example for retention is a social product. If a user signs up and follows a bunch of people (activation), all of our effort is for nothing if they never come back. We'll have an empty room, no matter how many new rows are added to our users table. Returning within a few days, probably several times, would represent strong retention.
Actions that show up in our activation metric could also pull double-duty in a retention metric. In the Uber example, taking one ride is activation, while taking three rides in a month would demonstrate retention.
It can also be important to think about retention over different periods. Once users remain sticky through the first thirty days, measuring retention over months can also be revealing.
Different products will have different usage patterns. A social app with only one or two visits a month might be a failure, while the same retention pattern for a finance product might be a success.
Retention setup
We can measure retention in PostHog using the retention insight.
This works by picking two events, and choosing a timeframe to measure against.
Let's say we want to measure retention of new users, based on whether they return to the product at all over the week after signing up.
- Baseline event: this is where we start measuring. We could choose an event like identify, or a custom event that's created to represent a signup. We could also start from an event that represents activation.
- Retention event: something we can measure related to the ongoing usage we hope to see. For our simple example, any pageview would work fine. But you could also be more specific, choosing a defined action or adding filters. This is helpful if there's a high value activity you want to measure, rather than any usage at all.
- Timeframe: we'd set this for any of the next 7 days. Retention measurement is granular: you can choose a timeframe from hours to months.
The result is a table that shows you, for any given day, what percentage of users returned, and how long it took them.
Reading a retention table
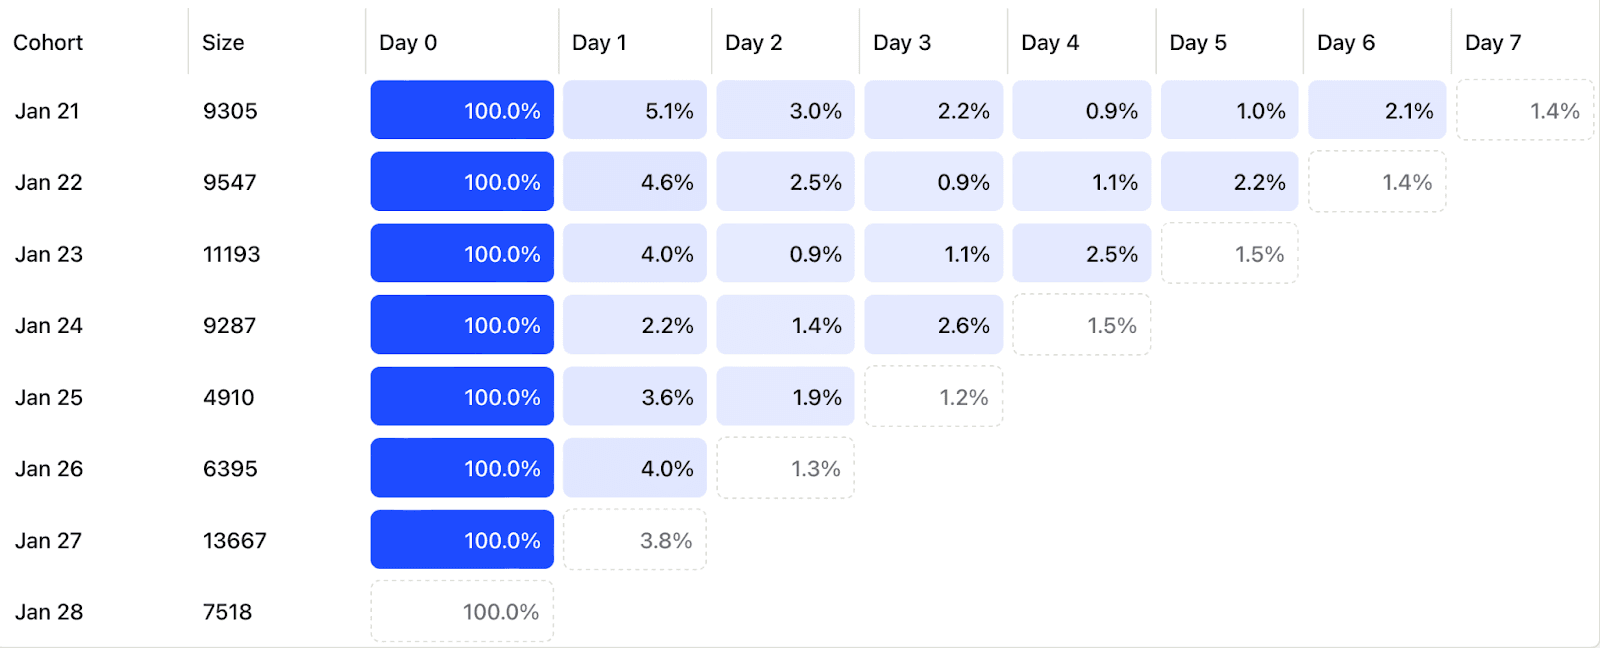
Each day in the reporting period of a retention table gives us a cohort of users who did our baseline event. That's why Day 0 is always 100%: it's where we start measuring.
For each period after day zero, the table reports the percentage of users who performed the retention event.
Days marked with dotted lines represent incomplete data.
So: for the 9,547 people who performed the baseline on January 22, 2.5% came back by day 2, and 2.2% came back by day 5. We don't yet have complete data for day six.
Retention planning

With all this in mind, let's plan for retention.
Our baseline event: [baseline event]
Our retention event: [retention event]
Retention timeframe: [retention timeframe]